




Short Intro
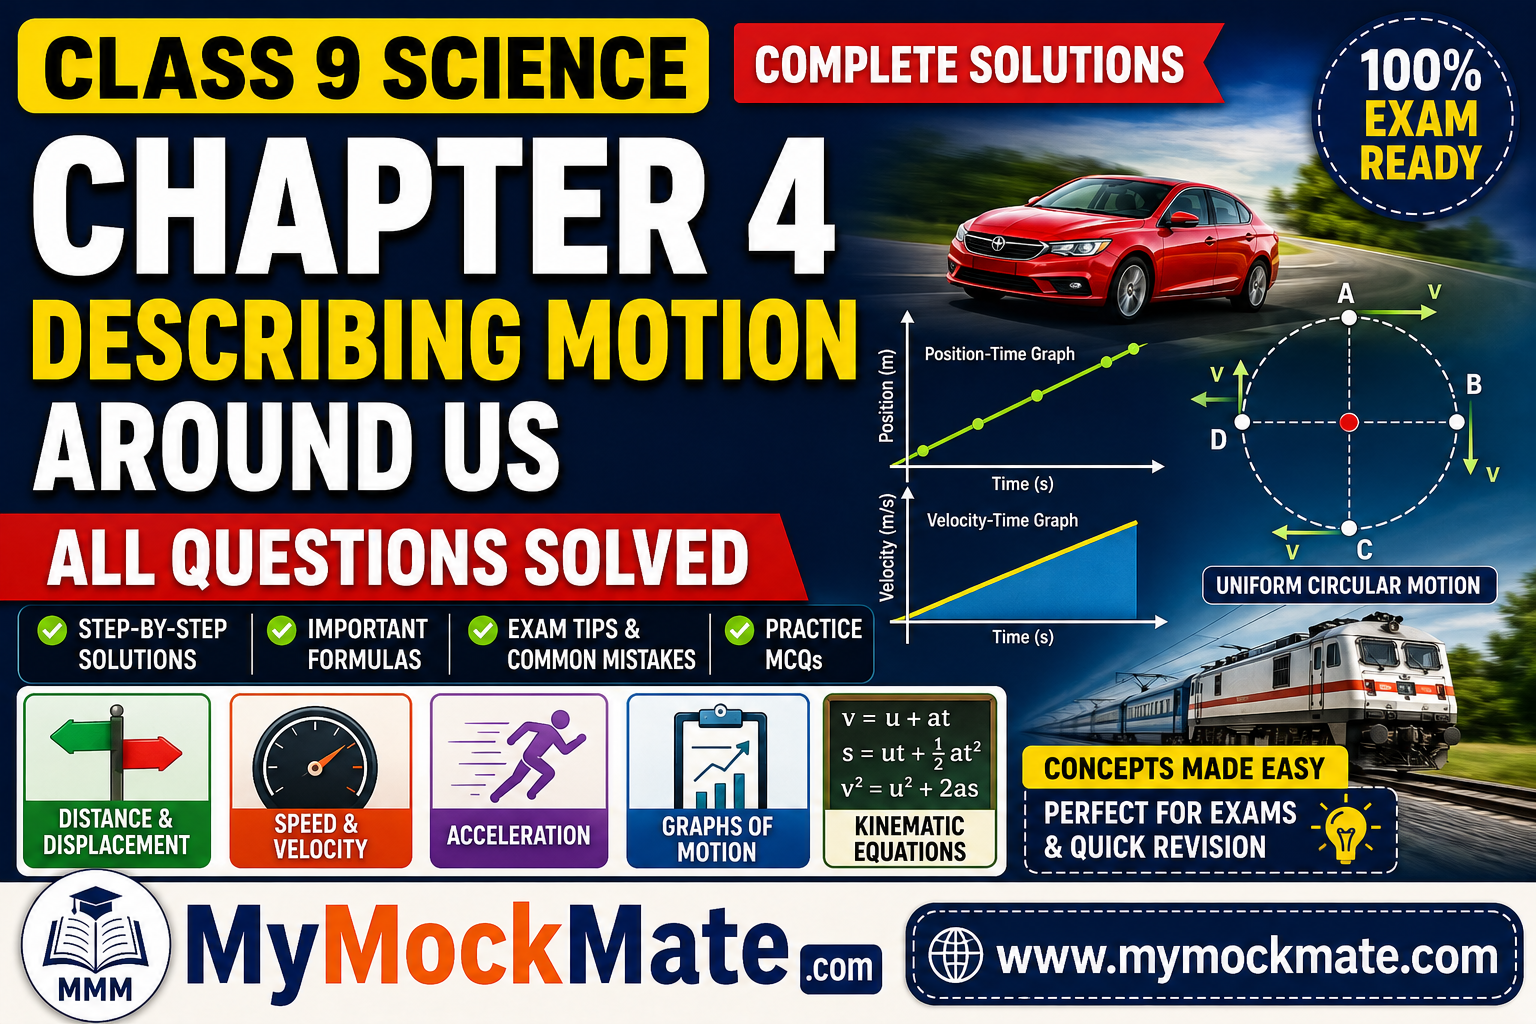
“Describing Motion Around Us” chapter explains the concepts of motion, distance, displacement, speed, velocity, acceleration, graphs of motion, kinematic equations, and circular motion. This chapter is very important for exams because it contains conceptual questions, graph-based numericals, and formula applications.
Quick Information Box
| Topic | Details |
|---|---|
| Chapter Name | Describing Motion Around Us |
| Subject | Science |
| Grade | Class 9 |
| Main Topics | Motion, Velocity, Acceleration |
| Important Concepts | Graphs & Kinematic Equations |
| Exam Importance | Very High |
| Numerical Problems | Included |
Concepts Used (Topics Covered)
- Distance and displacement
- Speed and velocity
- Average velocity
- Average acceleration
- Position-time graph
- Velocity-time graph
- Uniform motion
- Non-uniform motion
- Kinematic equations
- Uniform circular motion
- Motion in a plane
Important Formulas
Average Speed Formula
Average Velocity Formula
Acceleration Formula
First Equation of Motion
Second Equation of Motion
Third Equation of Motion
Think It Over
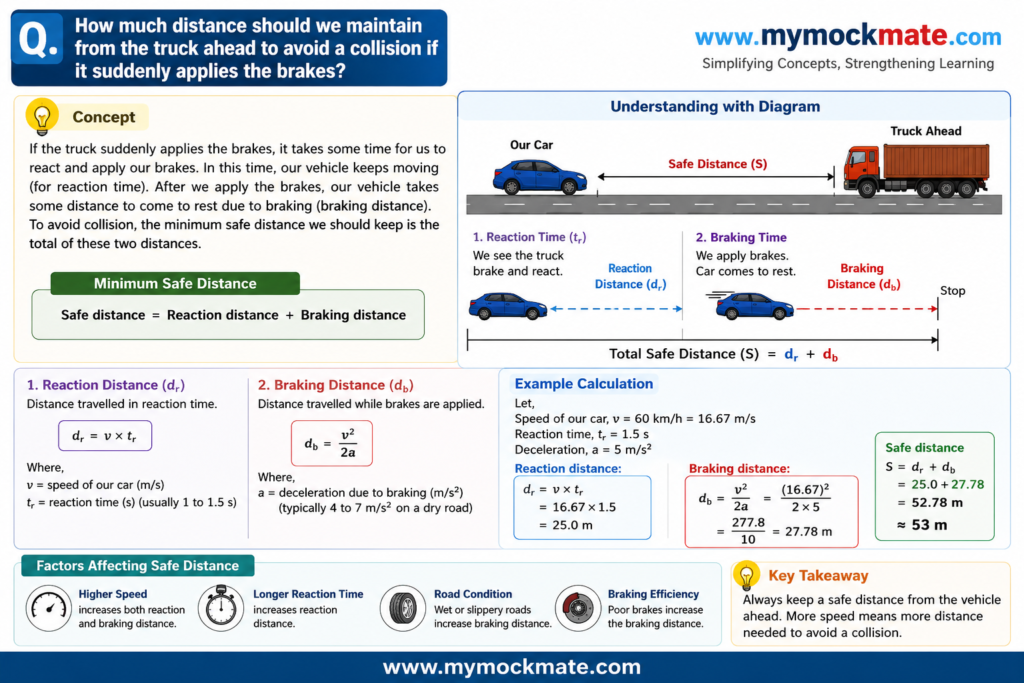
1. How much distance should we maintain from the truck ahead to avoid a collision if it suddenly applies the brakes?
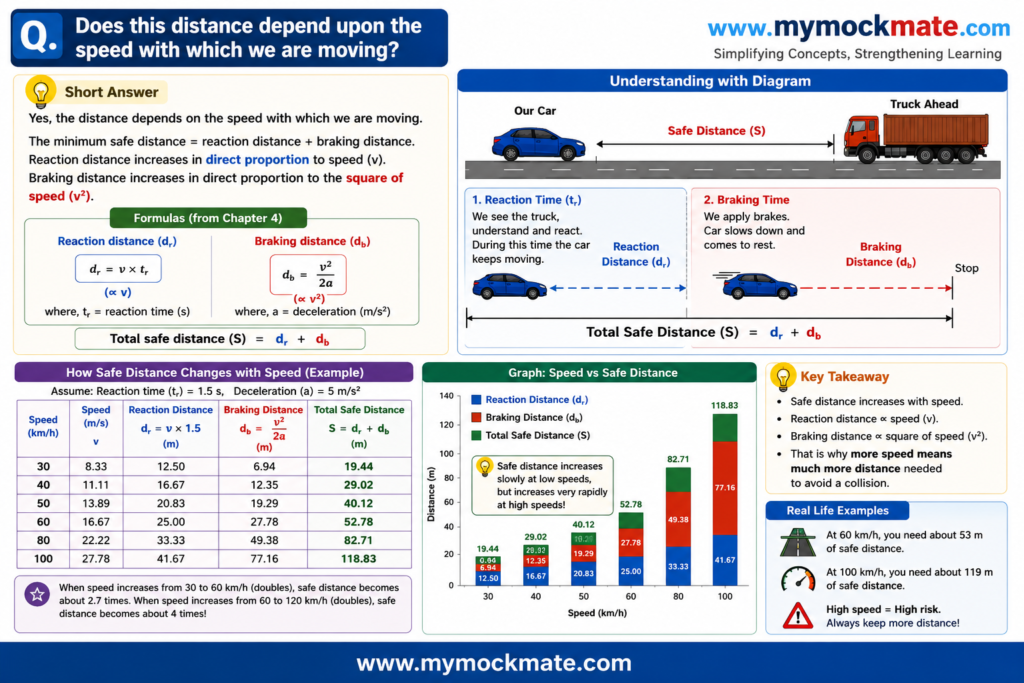
2. Does this distance depend upon the speed with which we are moving?
Pause and Ponder
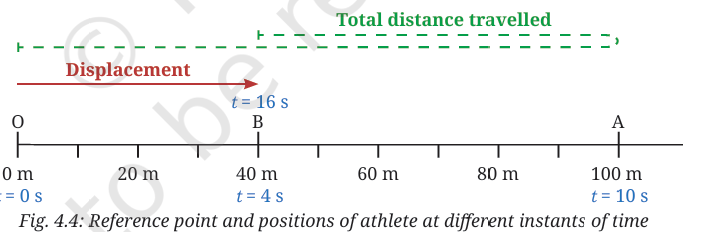
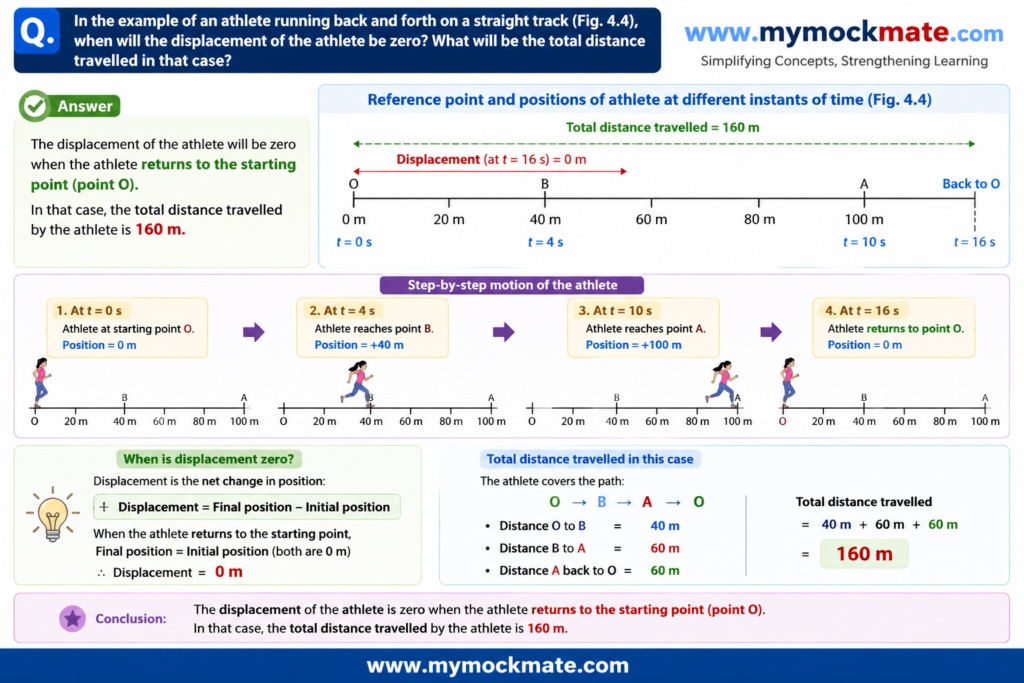
- an athlete running back and forth on a straight track (Fig. 4.4), when will the displacement of the athlete be zero? What will be the total distance travelled in that case?
- Fuel used up in a vehicle depends on which of the following? Justify your answer.
(i) Total distance travelled
(ii) Displacement

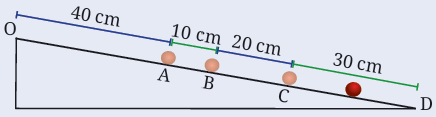
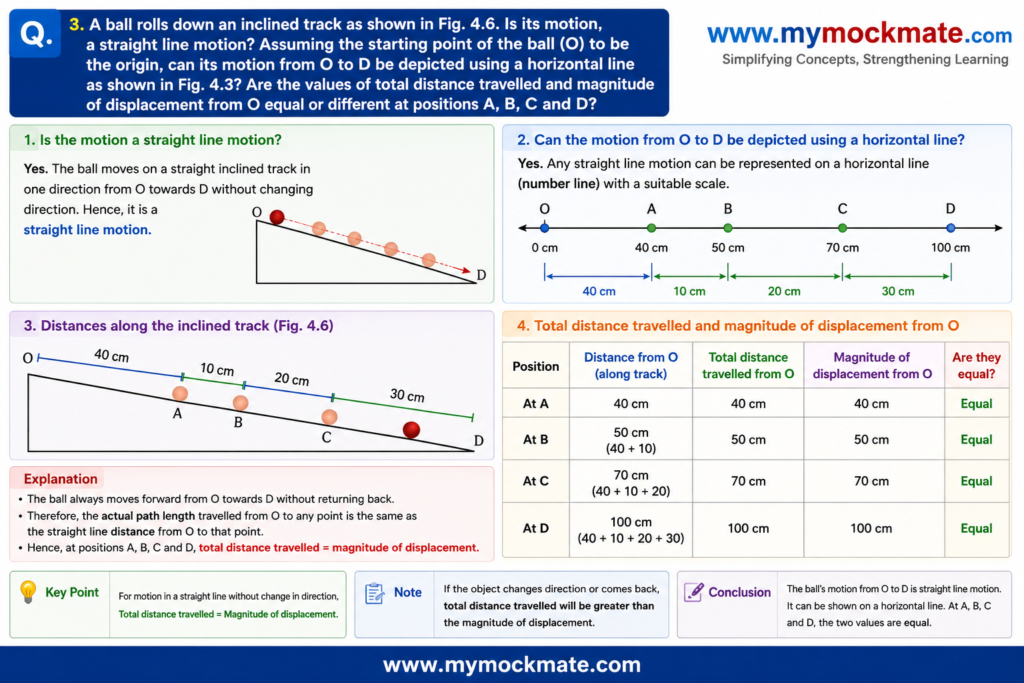
- A ball rolls down an inclined track as shown in Fig. 4.6. Is its motion, a straight line motion? Assuming the starting point of the ball (O) to be the origin, can its motion from O to D be depicted using a horizontal line as shown in Fig. 4.3? Are the values of total distance travelled and magnitude of displacement from O equal or different at positions A, B, C and D?

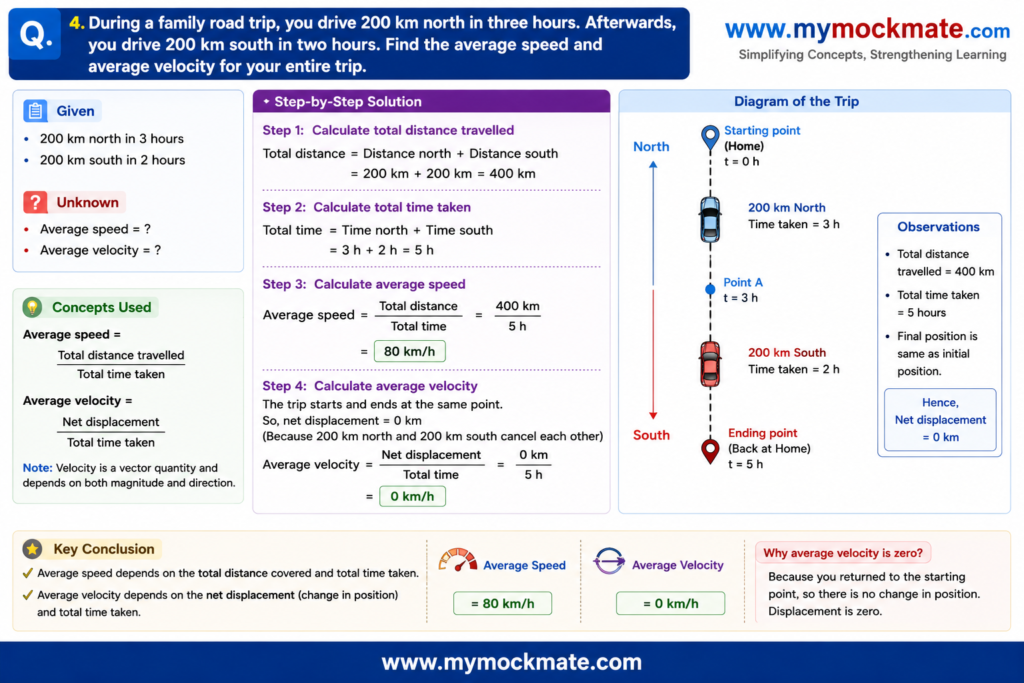
- During a family road trip, you drive 200 km north in three hours. Afterwards, you drive 200 km south in two hours. Find the average speed and average velocity for your entire trip
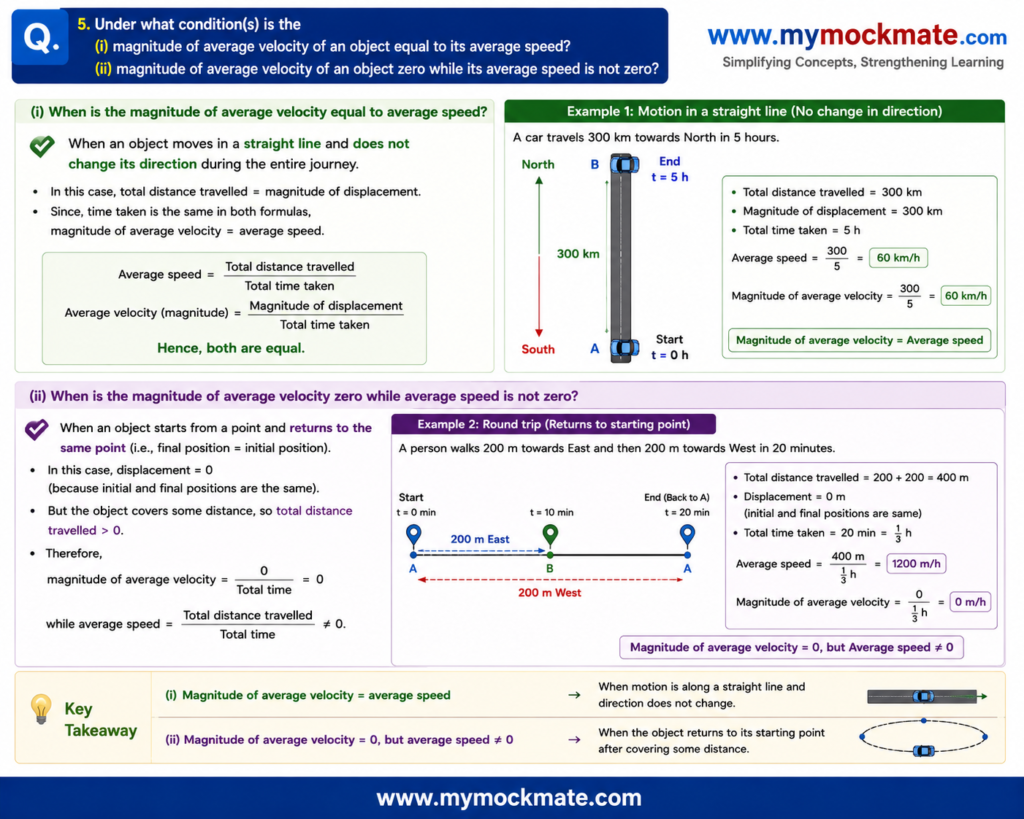
- Under what condition(s) is the
(i) magnitude of average velocity of an object equal to its average speed?
(ii) magnitude of average velocity of an object zero while its average speed is not zero?
Revise, Reflect, Refine
Question 1
My father went to a shop from home which is located at a distance of 250 m on a straight road. On reaching there, he discovered that he forgot to carry a cloth bag. He came home to take it, went to the shop again, bought provisions and came back home. How much was the total distance travelled by him? What was his displacement from home?

Question 2
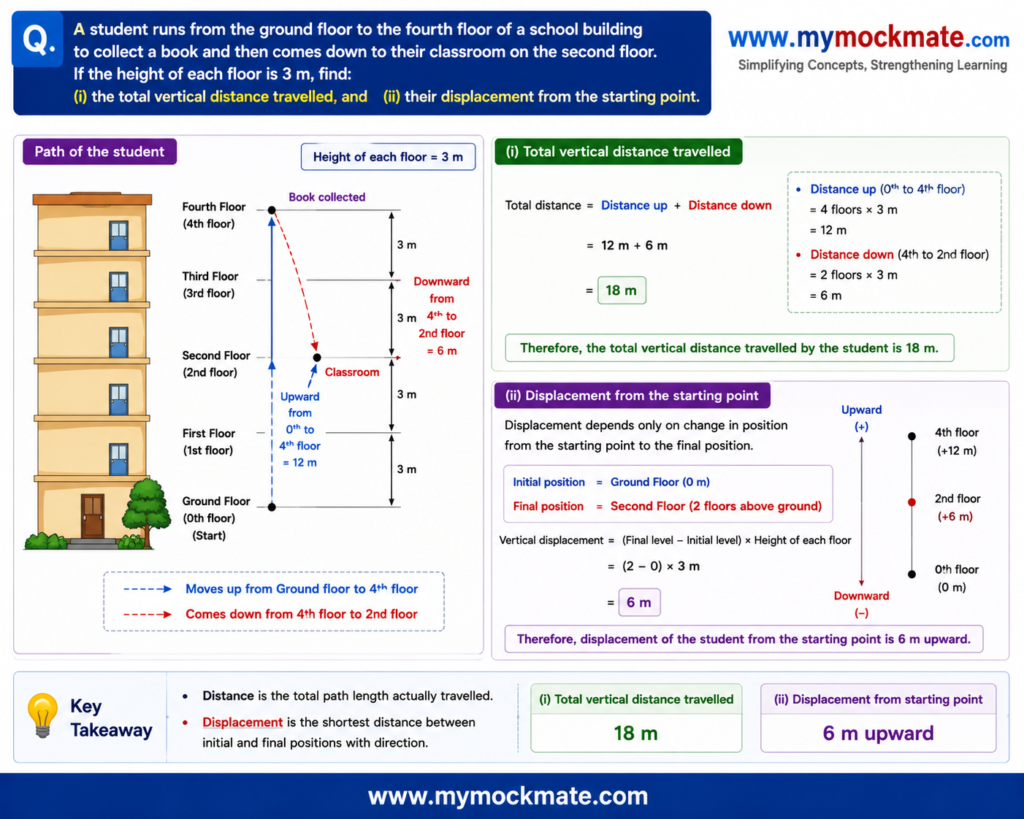
A student runs from the ground floor to the fourth floor of a school building to collect a book and then comes down to their classroom on the second floor. If the height of each floor is 3 m, find:
(i) the total vertical distance travelled, and
(ii) their displacement from the starting point
Question 3
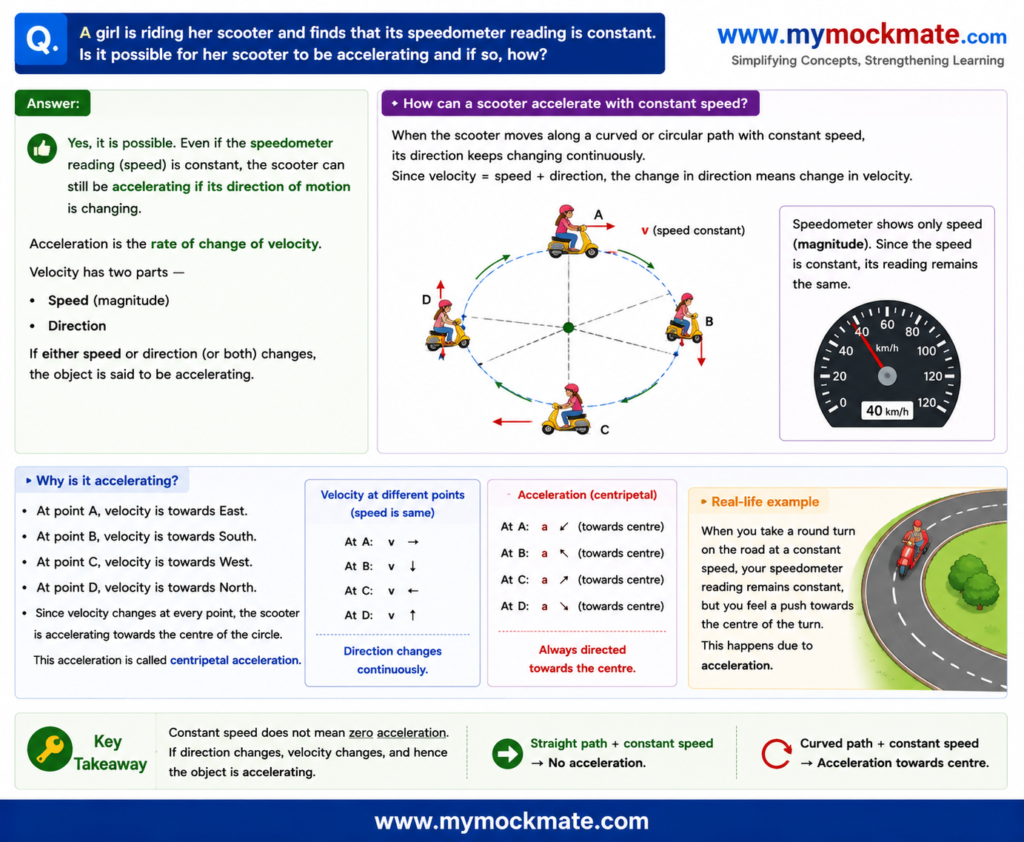
A girl is riding her scooter and finds that its speedometer reading is constant. Is it possible for her scooter to be accelerating and if so, how?
Question 4
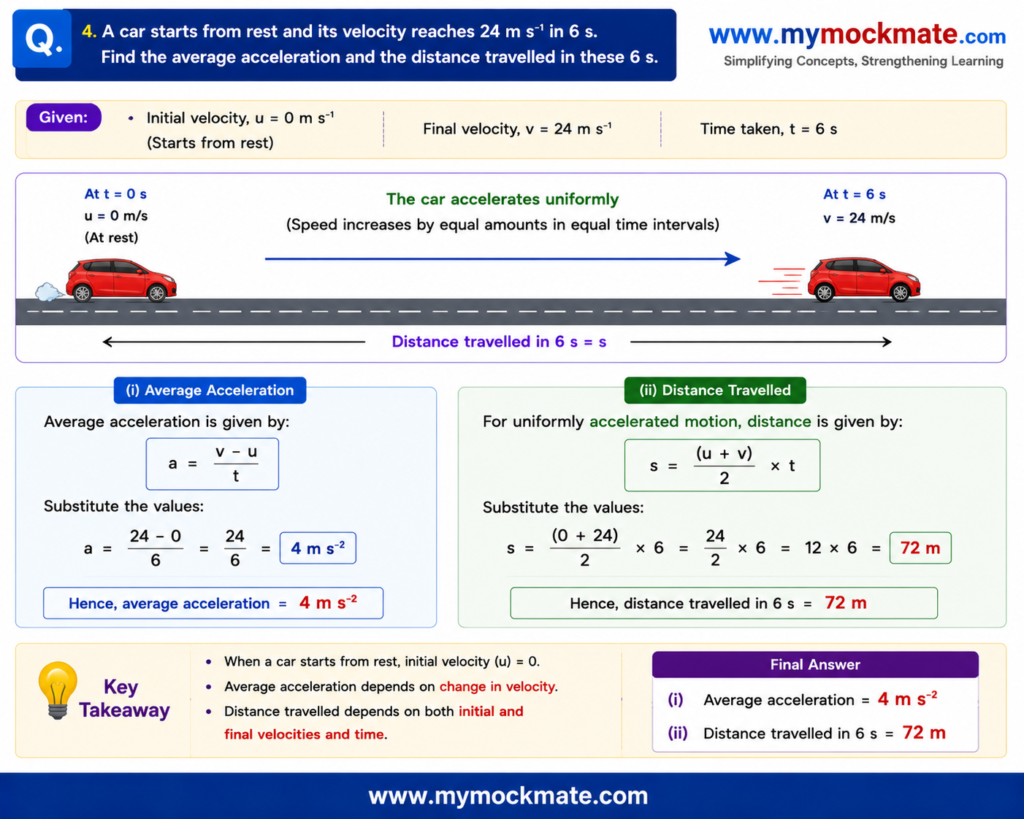
A car starts from rest and its velocity reaches 24 m s–1 in 6 s. Find the average acceleration and the distance travelled in these 6 s.
Question 5
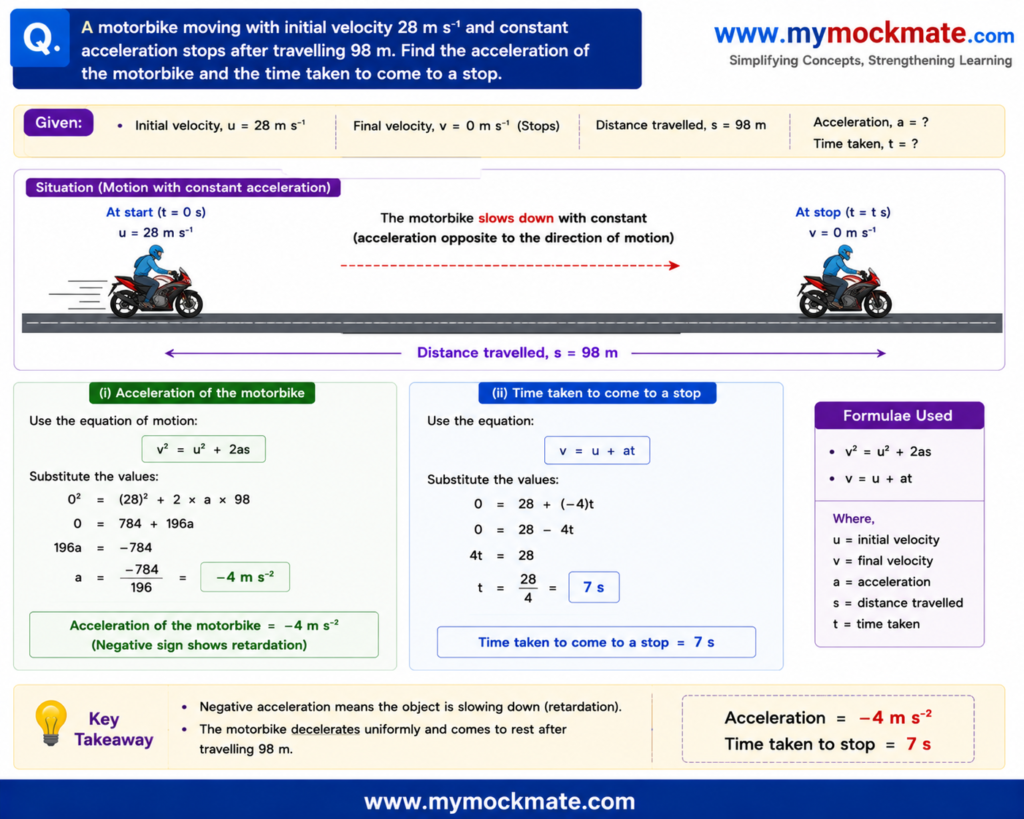
A motorbike moving with initial velocity 28 m s–1 and constant acceleration stops after travelling 98 m. Find the acceleration of the motorbike and the time taken to come to a stop.
Question 6
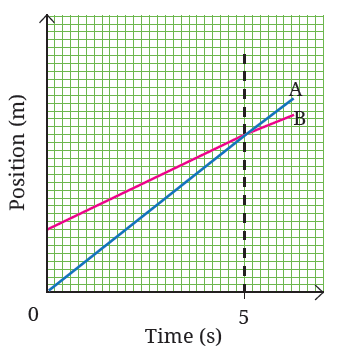
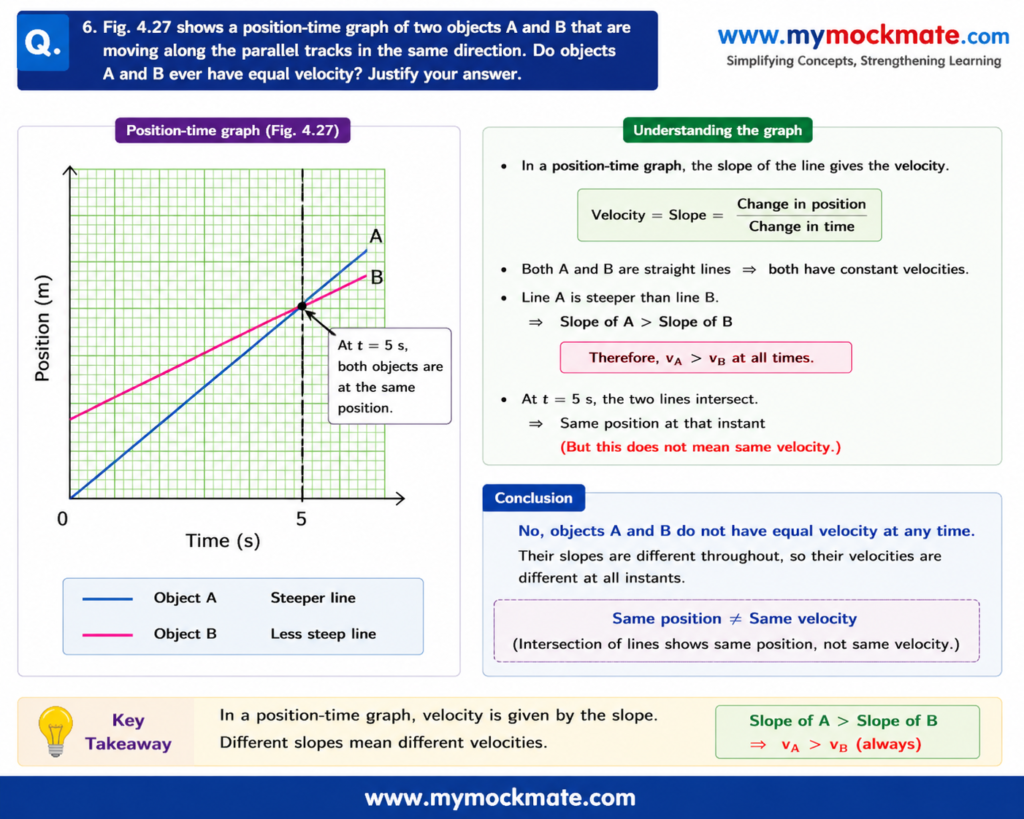
Following Figure shows a position-time graph of two objects A and B that are moving along the parallel tracks in the same direction. Do objects A and B ever have equal velocity? Justify your answer
Question 7
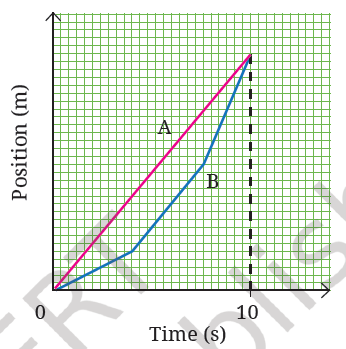
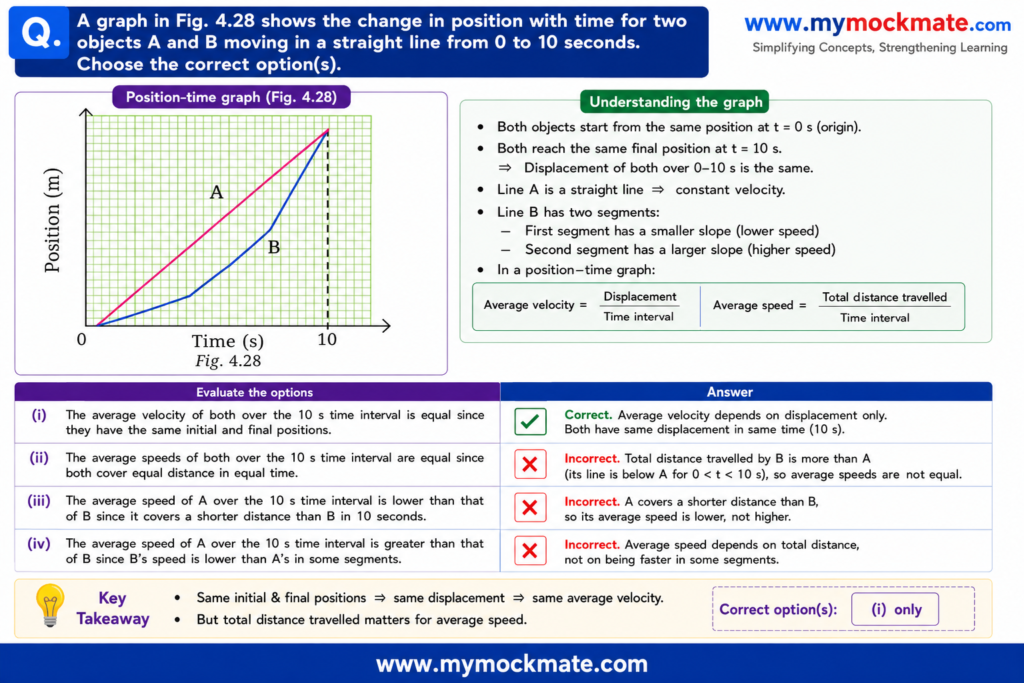
A graph in Fig. 4.28 shows the change in position with time for two objects A and B moving in a straight line from 0 to 10 seconds. Choose the correct option(s).
(i) The average velocity of both over the 10 s time interval is equal since they have the same initial and final positions.
(ii) The average speeds of both over the 10 s time interval are equal since both cover equal distance in equal time.
(iii) The average speed of A over the 10 s time interval is lower than that of B since it covers a shorter distance than B in 10 seconds.
(iv) The average speed of A over the 10 s time interval is greater than that of B since B’s speed is lower than A’s in some segments.
Question 8
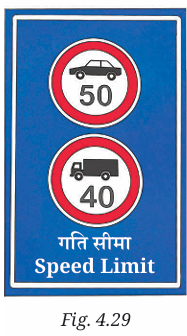
A truck driver driving at the speed of 54 km h–1 notices a road sign with a speed limit of 40 km h–1 (Fig. 4.29) for trucks. He slows down to 36 km h–1 in 36 s. What was the distance travelled by him during this time? Assume the acceleration to be constant while slowing down.

Question 9
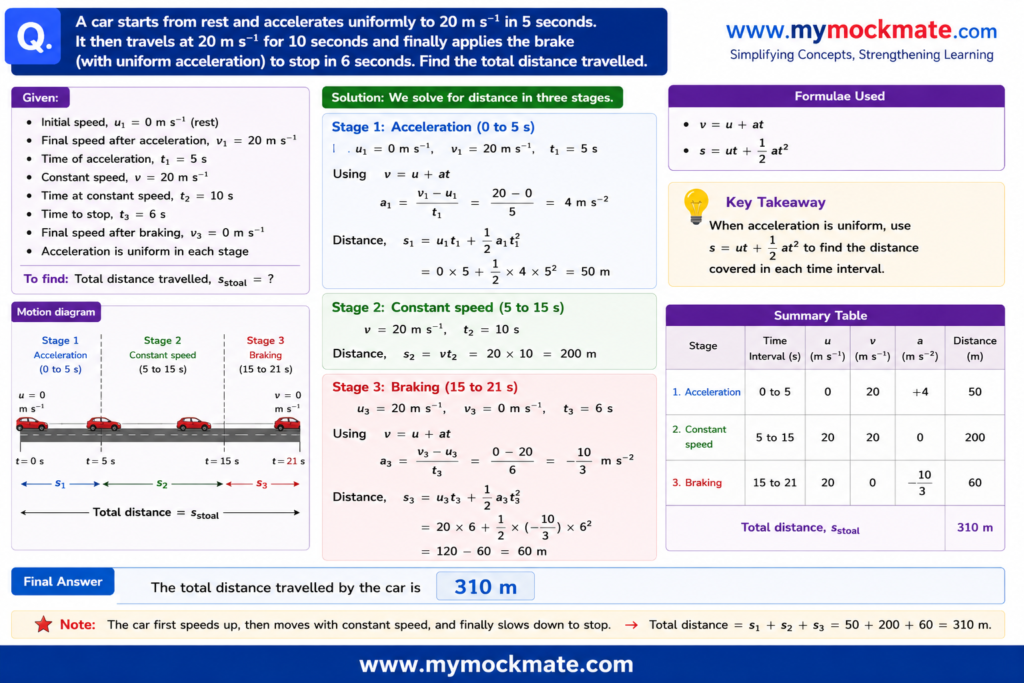
A car starts from rest and accelerates uniformly to 20 m s–1 in 5 seconds. It then travels at 20 m s–1 for 10 seconds and finally applies the brake (with uniform acceleration) to stop in 6 seconds. Find the total distance travelled.
Question 10
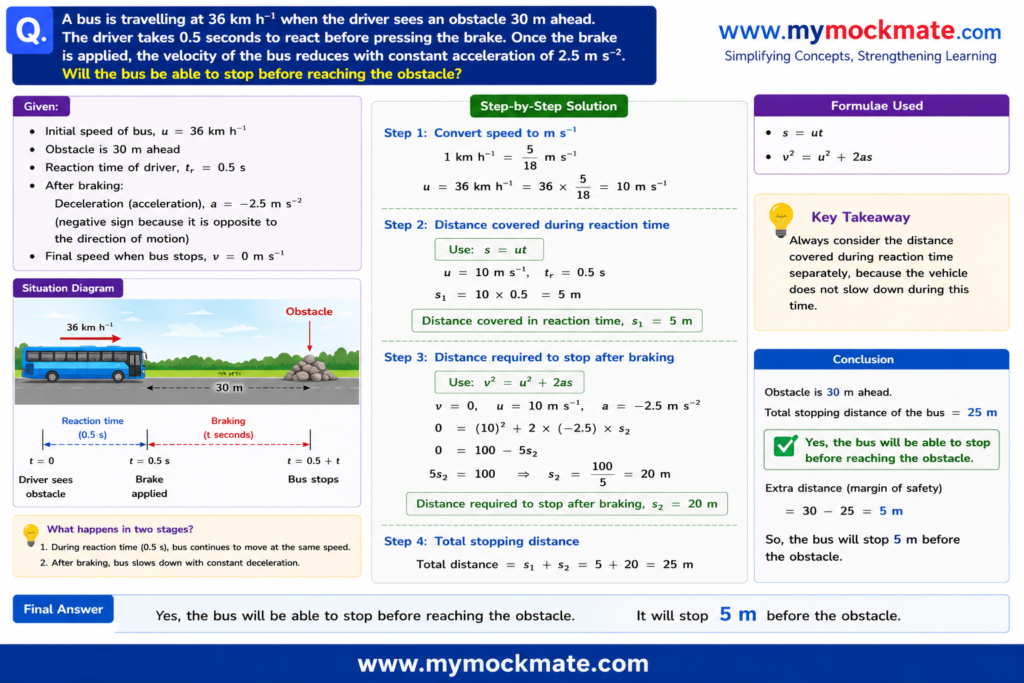
A bus is travelling at 36 km h–1 when the driver sees an obstacle 30 m ahead. The driver takes 0.5 seconds to react before pressing the brake. Once the brake is applied, the velocity of the bus reduces with constant acceleration of 2.5 m s–2. Will the bus be able to stop before reaching the obstacle?
Question 11
A student said, “The Earth moves around the Sun”. In this context, discuss whether an object kept on the Earth can be considered to be at rest.

Question 12
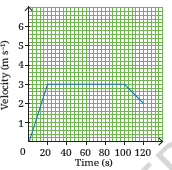
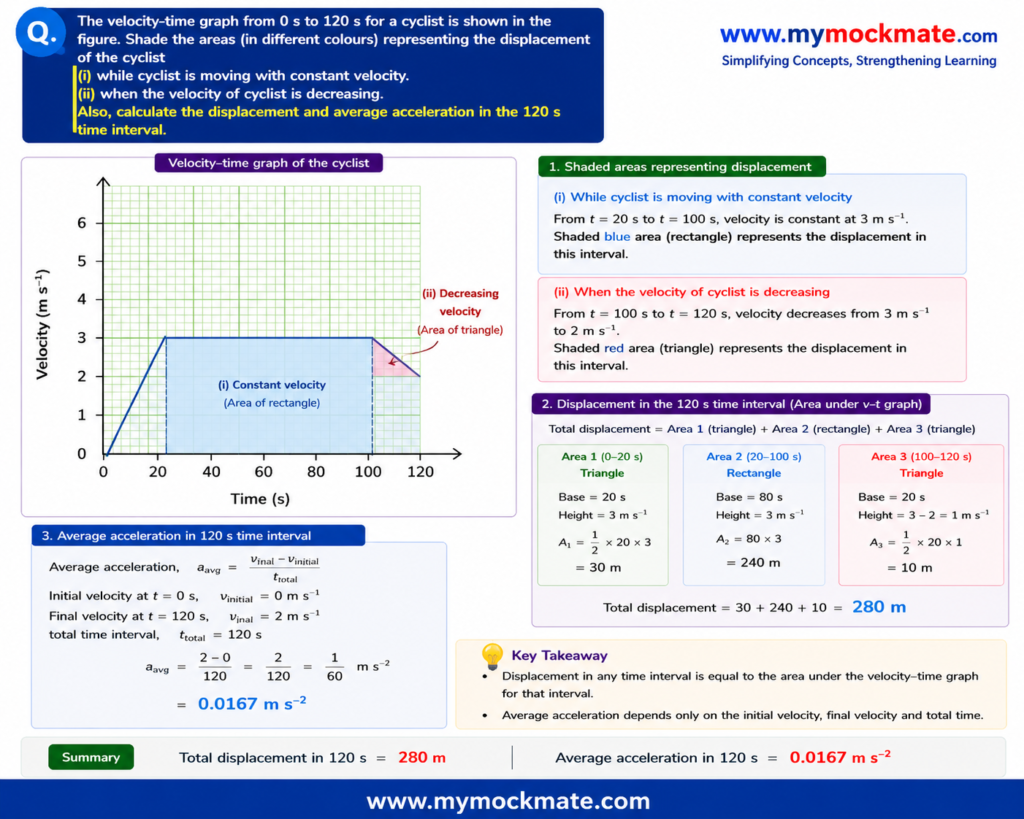
The velocity-time graph from 0 s to 120 s for a cyclist is shown in Following Figure Shade the areas (in different colours) representing the displacement of the cyclist
(i) while cyclist is moving with constant velocity.
(ii) when the velocity of cyclist is decreasing.
Also, calculate the displacement and average acceleration in the 120 s time interval
Question 13
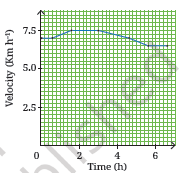
A girl is preparing for her first marathon by running on a straight
road. She uses a smartwatch to calculate her running speed at
different intervals. The graph (Shown in Following Figure) depicts her velocity versus
time. Estimate the distance she ran based on the graph.

Question 14
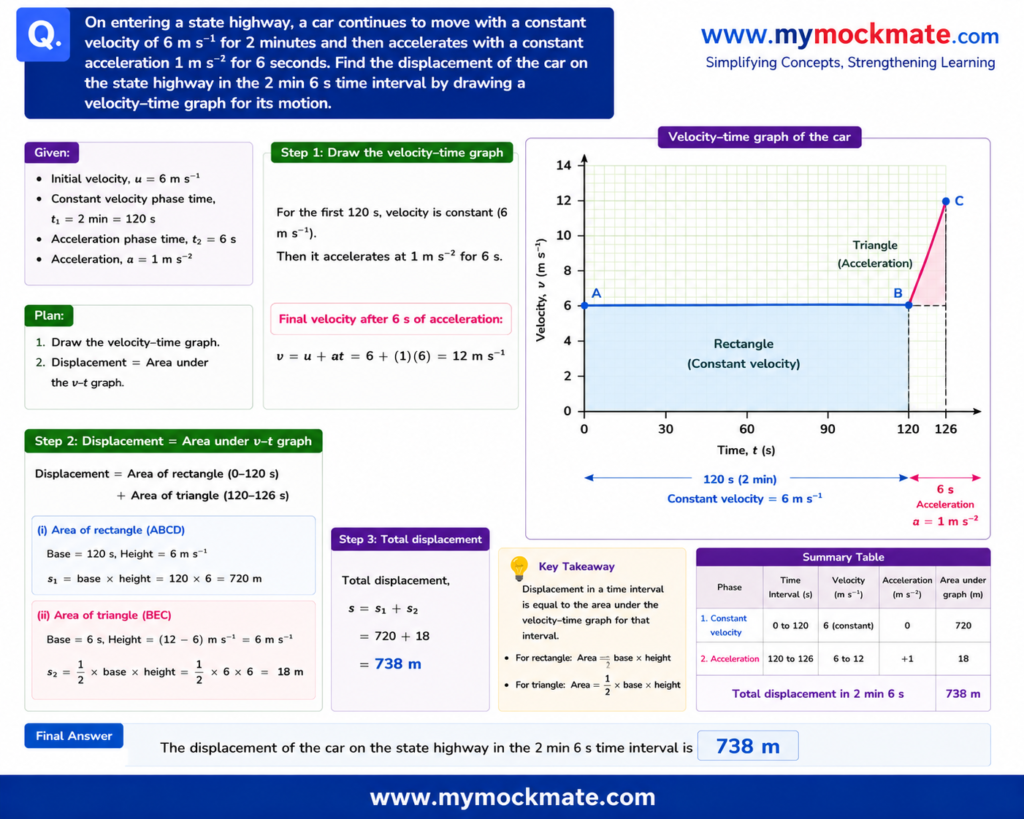
On entering a state highway, a car continues to move with a constant velocity of 6 m s–1 for 2 minutes and then accelerates with a constant acceleration 1 m s–2 for 6 seconds. Find the displacement of the car on the state highway in the 2 min 6 s time interval by drawing a
velocity-time graph for its motion.
Question 15
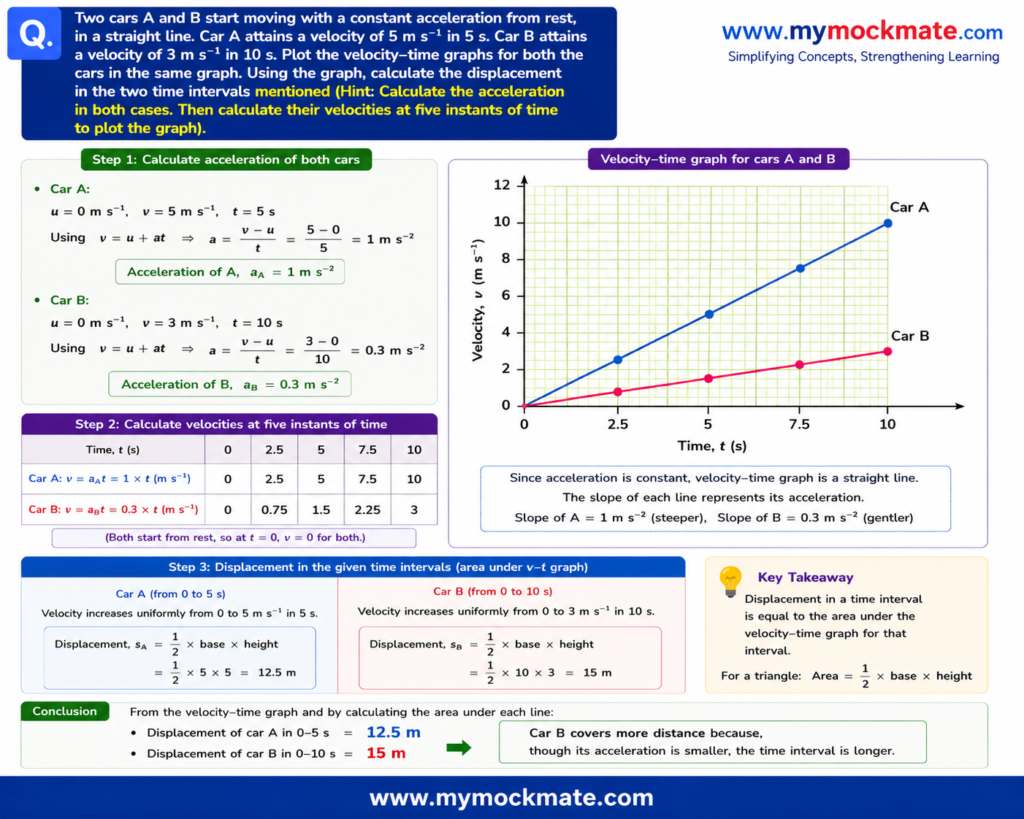
Two cars A and B start moving with a constant acceleration from rest, in a straight line. Car A attains a velocity of 5 m s–1 in 5 s. Car B attains a velocity of 3 m s–1 in 10 s. Plot the velocity-time graphs for both the cars in the same graph. Using the graph, calculate the displacement in the two time intervals mentioned (Hint: Calculate the acceleration in both cases. Then calculate their velocities at five instants of time to plot the graph).
Question 16
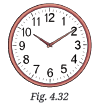
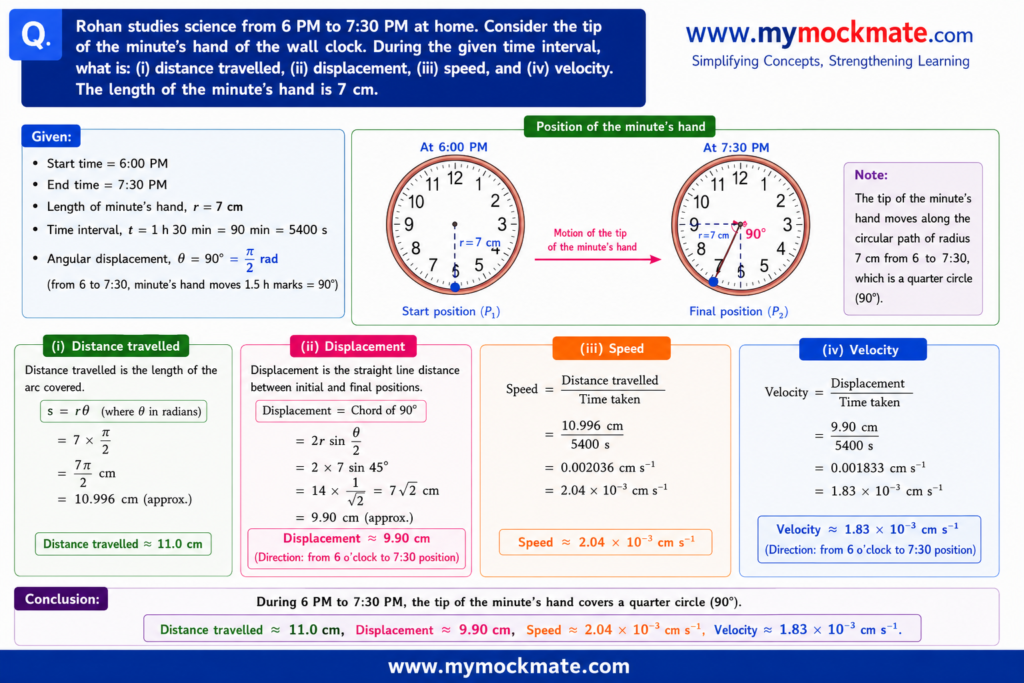
Rohan studies science from 6 PM to 7:30 PM at home. Consider the tip of the minute’s hand of the wall clock. During the given time interval, what is its:
(i) distance travelled,
(ii) displacement,
(iii) speed, and
(iv) velocity.
The length of the minute’s hand is 7 cm (Shown in Following Figure).
Common Mistakes
- Confusing speed with velocity
- Forgetting SI units
- Using wrong sign for acceleration
- Mixing distance and displacement
- Incorrect graph slope calculations
Exam Tips
- Memorize all three equations of motion.
- Practice graph-based numericals daily.
- Always convert km/h into m/s before solving.
- Draw diagrams for displacement problems.
- Remember: slope gives velocity or acceleration.
Practice MCQs
1. SI unit of acceleration is:
A. m
B. m/s
C. m/s²
D. km/h
Answer
C. m/s²
2. Which quantity has direction?
A. Speed
B. Distance
C. Velocity
D. Path
Answer
C. Velocity
3. Area under velocity-time graph gives:
A. Speed
B. Distance
C. Displacement
D. Acceleration
Answer
C. Displacement
4. Uniform circular motion has:
A. Zero acceleration
B. Constant direction
C. Changing velocity direction
D. Zero speed
Answer
C. Changing velocity direction
FAQ Section
Q1. What is displacement?
Displacement is the shortest distance between initial and final position with direction.
Q2. What is acceleration?
Acceleration is the rate of change of velocity.
Q3. What does slope of velocity-time graph represent?
It represents acceleration.
Q4. Which graph gives displacement?
Area under velocity-time graph gives displacement.
Q5. What is uniform motion?
Motion with constant velocity is called uniform motion.
Prepare smarter with complete chapter notes, solved numericals, MCQs, assertion-reason questions, and exam-ready solutions only on MyMockMate. Start practicing daily and improve your Science scores with confidence!